

 Download
 Buy
BuyPostgreSQL Maestro online Help
| Prev | Return to chapter overview | Next |
Debug information
Breakpoint list
The tab contains all the information about the session breakpoints.
Viewing variable values
If you want to view variables values, you need to create a watch with the Watch list tab pop-up menu. Just select Add Watch and enter the variable name.
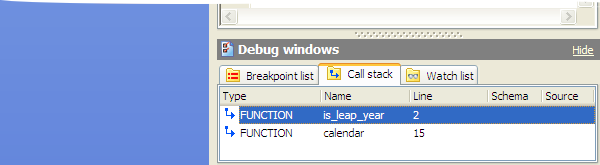
Viewing the call stack
Whenever the debugger is paused, you can use the Call stack window to see the procedure flow as a stack of method calls that got you to the current line. It is automatically updated after each debug step.
| Prev | Return to chapter overview | Next |